The USDA released its quarterly Grain Stocks report on September 30, 2026, providing an official physical tally of old-crop inventories across farms and commercial storage as of September 1. While corn drew the sharpest headlines due to a surprise build in holdings, data across soybeans, wheat, and corn revealed noticeable shifts when compared against previous estimates from the September 12 WASDE report.
Here is a full commodity comparison of how the physical inventory counts align with earlier WASDE expectations.
Corn: Large Old-Crop Surplus
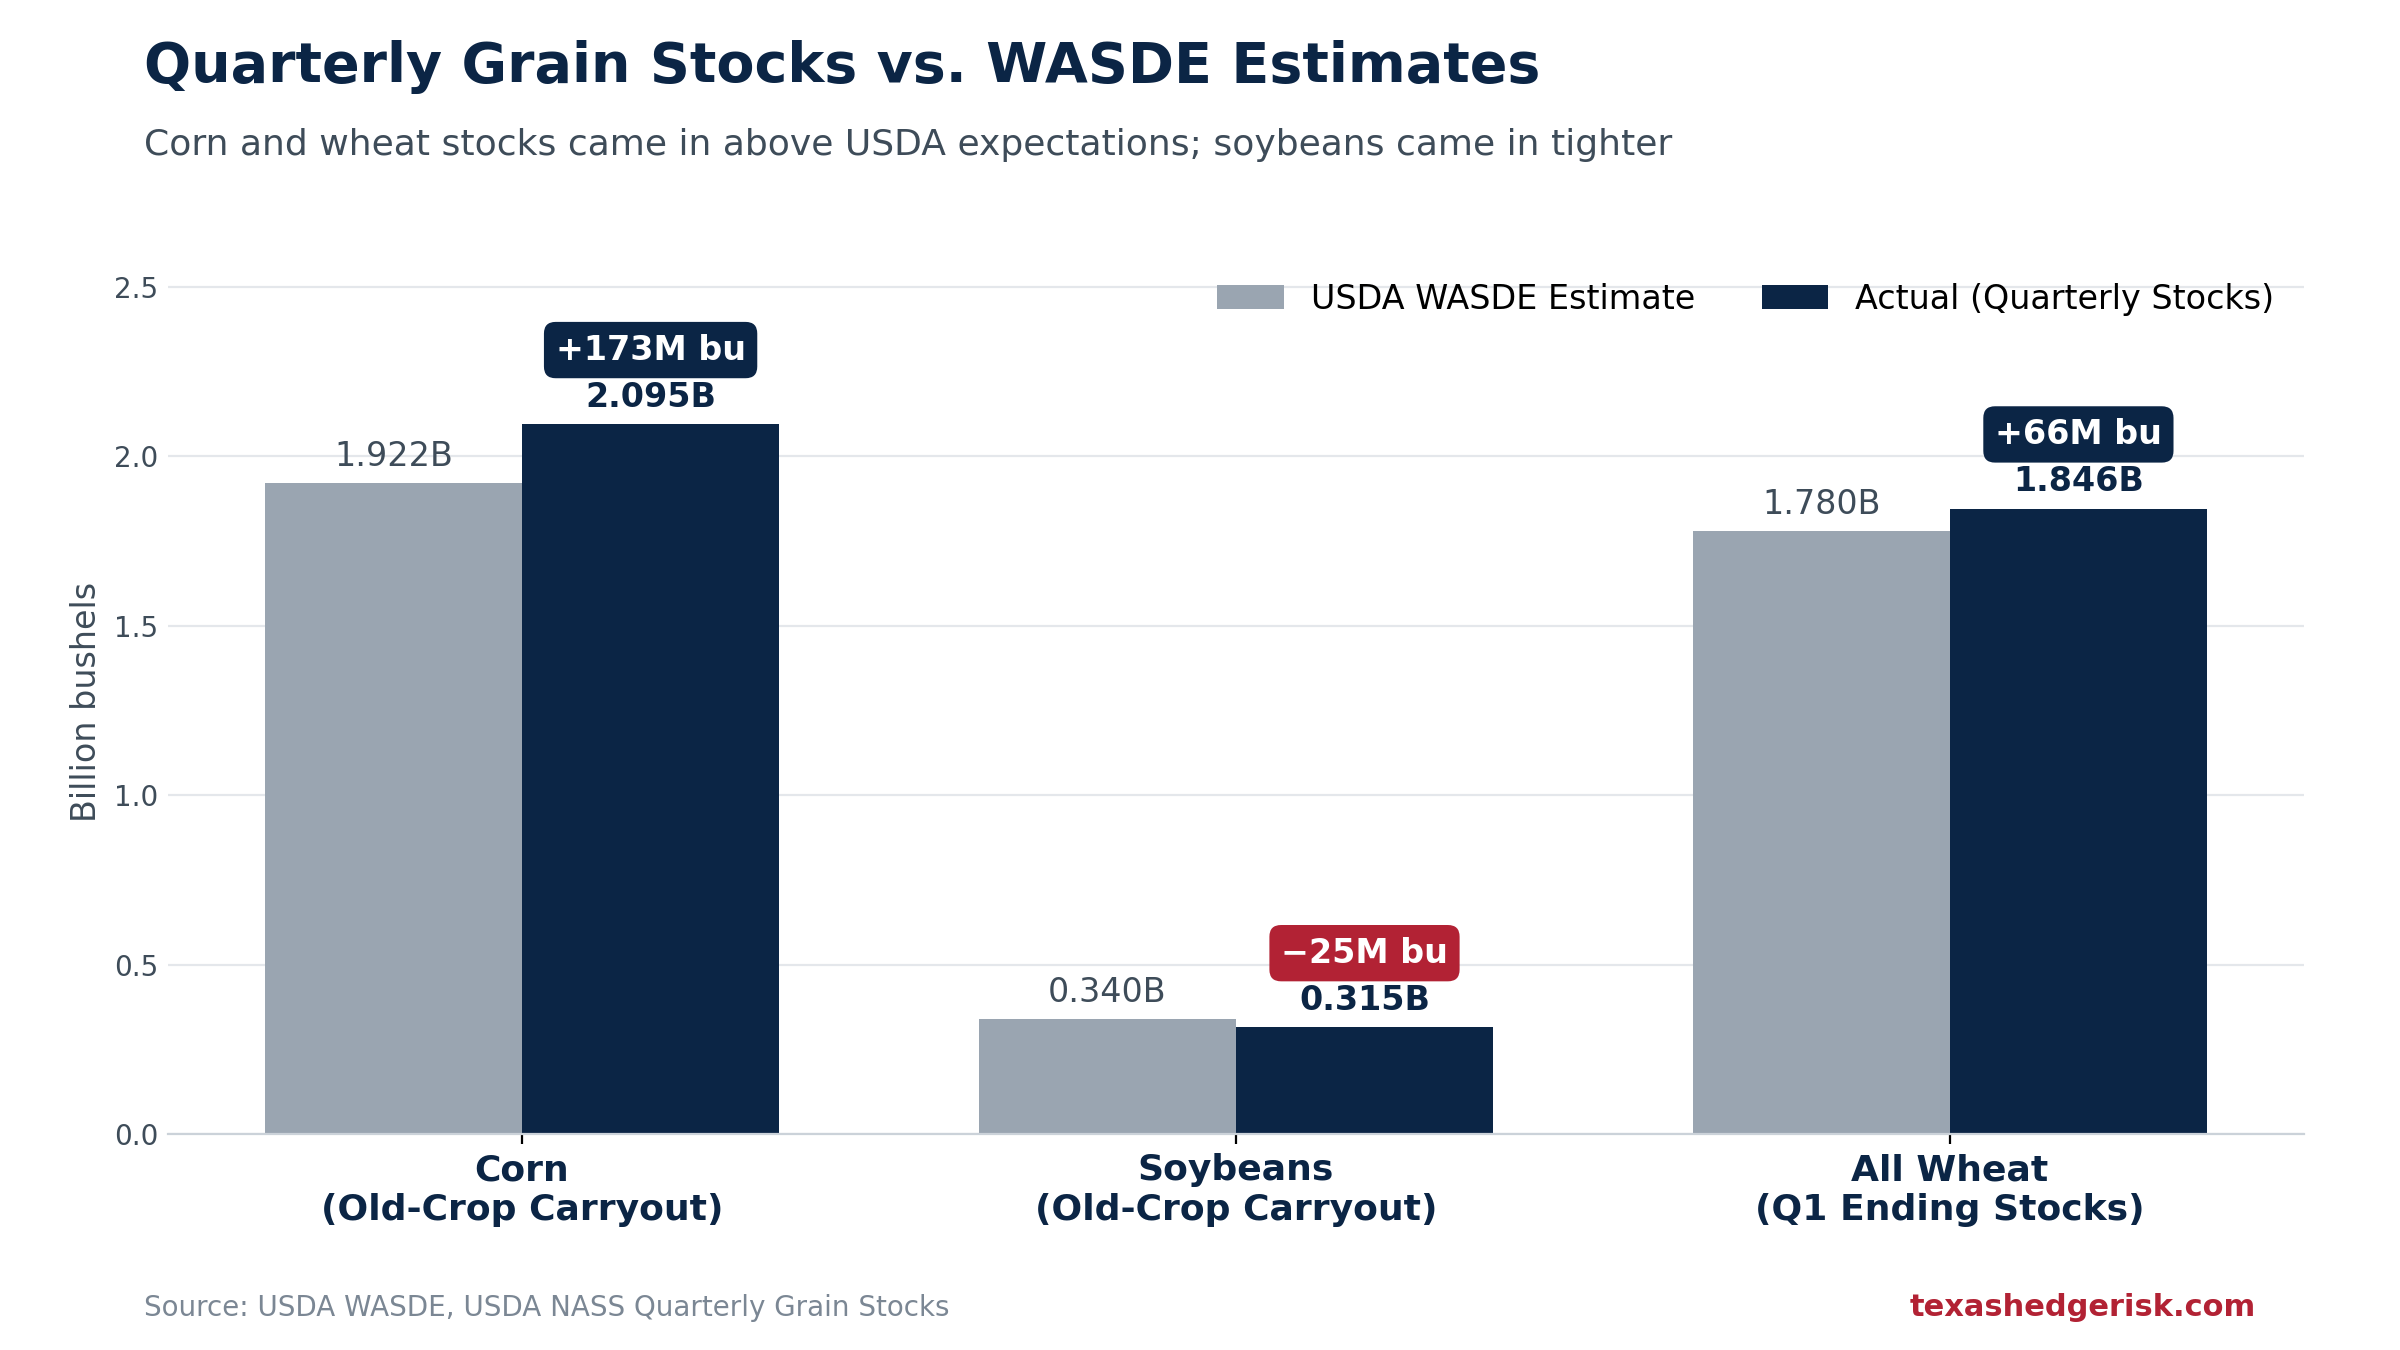
Old-crop corn inventories provided the report's headline shock, exceeding trade estimates and topping earlier USDA models.
- September 30 Grain Stocks: 2.095 billion bushels (787 million bushels stored on-farm; 1.31 billion bushels stored off-farm).
- September WASDE Projection: 1.922 billion bushels.
- The Variance: +173 million bushels higher.
What Drove the Difference?
Fourth-quarter (June–August) implied disappearance reached 3.20 billion bushels up from 3.10 billion bushels during the same period in 2025. However, this draw-down was not aggressive enough to offset large starting carry-in supplies. The result pushed old-crop carryout above the 2.0 billion bushel mark, triggering immediate downward pressure on futures prices.
Soybeans: Tighter Than Forecast
Soybean holdings contracted more than anticipated, signaling strong domestic crushing and late-season export usage during the summer months.
- September 30 Grain Stocks: 315 million bushels (90.4 million bushels on-farm; 225 million bushels off-farm), down 3% year-over-year.
- September WASDE Projection: 340 million bushels.
- The Variance: -25 million bushels lower.
What Drove the Difference?
June–August disappearance expanded to 744 million bushels, up from 683 million bushels a year prior. This tighter ending stock total provides a leaner starting carry-in supply for the 2026/27 marketing year balance sheet.
All Wheat: Physical Tally Beats Expectations
Because the wheat marketing year begins June 1, the September 1 figure represents Q1 ending stocks rather than old-crop carryout.
- September 30 Grain Stocks: 1.846 billion bushels (547 million bushels on-farm; 1.30 billion bushels off-farm), down 14% year-over-year.
- September WASDE Implied Estimate: ~1.780 billion bushels.
- The Variance: ~+66 million bushels higher.
What Drove the Difference?
First-quarter indicated disappearance fell to 608 million bushels compared to 710 million bushels last year, pointing to weaker-than-projected feed and residual usage during the summer.